This is an excerpt from an email I got last Tuesday from one of those colleagues that keep pushing newsletters:
“No, I haven’t been hitting the eggnog early this year! The table is now set for a fierce rally, and it’s time to claim your spot at the feast or get left behind. That’s why you are about to hear me say something I say very rarely… It’s time to back up the truck and buy our top game-changing stocks for 2012. We’re seeing some dramatic changes in this market that signal we’re about to see a rally that will take us all the way to Dow 13,000.”
So what do you think, Dow 13000 or Dow 8000 some months from now?
By points:
B ended at 11231
Possible C conclusions are A (1576) x 0.618 + 11231= around 12200
A (1576) + 11231 = around 12800
By time:
Either C ends this week or 1.618 x 25 from Nov 25 = around 4 – 7 January 2012
Logical thinking: 12800 would retrace 1 completely, 12200 is a 72% retracement of 1, 12200 is preferred
Conclusion: if 12200 is going to be the end, either the markets will keep zigzagging for 3 or 4 weeks or start going down immediately, maybe it’s time to buy some VXX calls.
Sorry for not posting most often, I have a very demanding day job
Feliz Navidad a todos,
Technical Analysis of the Financials Markets, Swing Trading Speculation
Hi, these are just ideas not recommendations, sometimes I trade my ideas, sometimes I don’t.
Always remember, yours is the responsibility for your trades,
Good luck,
Erick
Always remember, yours is the responsibility for your trades,
Good luck,
Erick
Thursday, December 22, 2011
Tuesday, December 13, 2011
Wave 2 when are you ending
Both the Dow and the Wilshire produced yesterday P&F breakdown, the SP was already in bearish mode.
The Dow will have to touch the 12250 level on an up day to reverse the bearish signal.
The Dow traded below 12000 yesterday but managed to close above that level.
For the past 6 days both 12200 and 12000 were touched 3 times, the price-volume bar confirms the importance of this range.
The flag formation of the Dow has a bullish connotation, a close above the upper line will produce a top price around 12500. Personally and looking at the inability of the Dow to hold below 12000, I think the end of this reversal that started on October 4 will be around 12500. Close to that level I will add to my short positions but I really would be very satisfied if the Dow starts wave 3 without reaching it.
Ya veremos el cierre de hoy,
Buenos Dias,
Sunday, December 11, 2011
Again wave 2
Waiting for the end of this 2 wave could be an exercise of patience, I am completely and 100% ultrashort and with some puts to add a little interest, so my only action is trying to figure the end.
If there's some true in the “fractality” ?? form of markets, wave 2 looks at its end.
A relationship of equals between a and c looks improbable since wave c would end above 13000 so a 0.618 is with some high probability. That would put Dow at 12400 at the end of c. A more or less truncated c is in agreement with c of 2 of 1.
Time relationship, internal and external trendlines, put the c below 12400 at the end of this week or at 12500 at year's end.
And last but not least, the Dollar can make a last push before retracing and then not look back for a long time, the inverse relationship between markets and Dollar could work like this.
Buenas tardes,
Tuesday, December 6, 2011
Thursday, December 1, 2011
1-12-11
I am more or less convinced on this double zigzag because of the month we are, the markets should hold or maybe rally in December. I posted briefly on a market rebound on Nov. 28.
Now, I was expecting the market to drop almost to 11000 because of channel measuring techniques since the 500+ channel broke down near 11600. The market hold above an important internal trend line and that did not work.
Guideline for wave 2 retracing up to 81% put the final c around 12,400, first the market must break above an important down trend line that was topped yesterday.
A triangle is unlikely in wave 2 unless is a complex formation, if that is the case we will have a long time without trend.
So what will be the level of blue b before the final push up to 12400?
Also, can this be a possibility ??
Ya veremos,
buen dia a todos,
Wednesday, November 30, 2011
Tuesday, November 29, 2011
Follow Up 29-11-11
I have not changed my bearish stance, however when ¾ of your unrealized puts profits disappear in a single trading day you kind of wonder.
11630 should hold as resistance for the down move to continue, definitively 11000 is my first target, based on the broken channel, also there is some intermediate significance at 11000
Some long resistance at 11230, 10530 would be a target if 11000 broken.
Let's see today action
Good day,
Thursday, November 24, 2011
Here´s another thought
Thanks to http://danericselliottwaves.blogspot.com/ for getting my attention to this perfectly parallel downward channel. The failure of the prices to reach the top of the channel is certainly an indication of a future break of the lower line. This is a 2000 point channel, if the lower line is broken the level minus 2000 is a new low target.
For the immediate future I am trying to project some consolidation area near the down line of the channel.
My first choice is a big flat with B wave stopping at the B1 10655 level fulfilling the great December-January almost etched rally.
My second projection is that BIG 2 ended definitively at 12231 on October 28, BIG 1 developed in 51 trading days and BIG 2 ending on October 28 had 19 trading days, 19/51 = 0.373, the nearest exact days relationship to 0.382.
With the channel measuring technique we'll put the end of 3 of 1 of BIG3 at 11000, then a 4 will stop around 11230 and 5 will be 573 points long same as 1 ending around 10655. With this scenario then we will have 2 of 1 of 3 running on December giving us some year end mini rally.
Anyway these are just possible scenarios, lets wait for the real development.
Monday, November 21, 2011
Thursday, November 17, 2011
Wednesday, November 16, 2011
Tuesday, November 15, 2011
Sunday, November 13, 2011
Triangle, Flat, Zigzag or What
I confess that I´m obsessed with the ratio analysis between waves and the purported fractal configuration of the market and waves; being that, let’s review the relationship.
Proposed Wave (a) could easily be 2 since 1576 points (12231-10655) is a 76% of 2069 (12724 – 10655), however now it doesn´t look that way, in the triangle A is 574 points, B is 513, C is 389, D is 373 and E could be 240 to end around 11900. That way we´ll have E/C= 0.618, C/A= 0.678, so if this is a (b) triangle it must certainly stop above the lower line with a possibility of an intraday undershoot. Citing Prechter , ¨ triangles always occurs in a position prior to the final actionary wave in the pattern of one larger degree¨, the (b) triangle wave of 2 fits that description perfectly.
Wave a of (a) is 989, 9.3% from 10655 to 11644 in 11 days, wave b is 247 or 25% of a, c of (a) is 834 or 7.3% in 11 days, we have a perfect time relationship between a and c of (a).
Now, if (b) is in fact a triangle ending around 11900, (c) must have some relationship with (a), .618 of (a) is 973 would carry (c) to 12873 right above our purposed 0, .382 of (a) is 602 ending (c) around 12500, I am not sure of the triangle now thinking about maybe a double tree.
12400 is the level for Wave 2 retracing 85% of 1, in that view I cannot see the markets going up much next week.
Sunday, November 6, 2011
Complicated, yet Simple
Here´s a thought from the forest to the trees
The big zigzag started after the Dow topped at 14,093 on the October 8 2007 week, the A wave ended at 6626.94 for a 7466 points or 53% decline from the top.
Big B ended at 12681 for a total of 6055 points, retracing 81% of A, now, B was a 3 a-b-c movement that developed like this:
a, 6626 – 11204 = 4578 points
b, 11204 – 9686 = 1518 points, 33% of a
c, ended at B, 9686 – 12681 = 2995 points, 65% of a, cool
Let´s go to the trees
We have the ¨exact¨ end of B on July 21 at 12,724.41, then 1 ran 2069 points to 10,655.30 on October 3, the return move took the Dow to 12,231.11 on Oct 28 for 1576 points or a 76% of wave 1.
What is next?
a) 12231 was the end of 2, the market will drop to the vicinity of 10,200 or below but then, what will happen with the almost infallible Santa Claus rally on December?
b) Wave 2 hasn´t ended yet, and we are in the b part of an a-b-c wave 2. If that´s the case the following will happen. Wave b of 2 will go down to one of this levels:
11,632 with c stopping at 12,600 max, right below the upper resistance line
11,443 with c stopping at 12,400 at the internal trend line
11,000 with c around 12600 maximum
With a Fridays’ close at 11983, we have a minimum 3% drop for the following days.
Beware of the BIG formation; it can take the Dow to a hopefully truncated C around 8000.
Tuesday, November 1, 2011
End of the road....?
It looks like 12200 was the top of this move that started around 10655 for a 14.5% gain in 18 trading days, you knew that couldn’t last forever.
The market should hold above 11700 at today’s close, if not, a rethink of the waves must be made.
A final up move will be the last chance for selling longs with a profit, that final move will end between 12000 and 12200, and then a consolidation can take the market to 11250. If reached, that is the level to start buying again.
Here is another look,
Sunday, October 30, 2011
OK, but what´s next?
There is some long term resistance around 12800, also the Dow stopped short of the internal trend line. I would be more comfortable if the index cross the line and it becomes support, that hasn’t come yet. We have a beautiful summation index, but you must remember is a bit lagging.
Wave U-V went from 10800 to 11645 for 845 points or almost 8%, if this wave was meant to be the biggest, the movement would have ended already around 12000.
Wave 1 on W-X is 550 points, wave 2 was a sharp 1 day correction of 207 points or an exactly 38 Fibonacci percent. Wave 3 still running is 557 points at Friday´s close. Hopefully the Dow will cross the internal trend line, if not, 11900 should act as support and the target for the end of the move will become clearer.
Mondays are the worst days of the week for the stock market, Fridays are the best so don’t be surprised if tomorrow the Dow closes low.
PS: Most of the times a compression of the moving averages gives us ample warning of a trend reversal, if that proves right you better let your profits run a little bit more.
Wednesday, October 26, 2011
Flextronics Price Reflex
The technology group has been lagging the general market for the last month but some industries within the group look strong. The electronic equipment industry is showing a one month positive relative strength against the Dow, within that group Flextronics is shinning with a RS above 10%.
Last Thursday after market close the company announced results for its second quarter ended September 30, net sales increased $622 million or 8% and the Co. generated $176 million of free cash flow for the quarter.
FLEX was trading inside a perfect up trending channel since mid-august, the upper line was broken in October 10 and seven days later it seemed that the price was returning to the channel.
The day following the announcement Flex broke decisively above the upper channel line closing almost 8% up with a super strong volume.
Channel measuring techniques result in a 7.30 immediate target for a quick 10% gain after today´s 6.63 close. The upper channel must act as support.
Disclosure: I bought FLEX today.
Thursday, October 20, 2011
Is the First up Leg still going?
The Dow found support today around 11400, more or less over the internal trend line.
Both 10 and 20 days momentum are positive. The index went from 10655 to 11644, a 9+% gain in 9 trading days, a consolidation was mandatory.
Most of the times the first up waves after a big drop retrace up to a 75% of the movement so be in the lookout.
Resistance at 11600 must be broken decisively for a continuation of the up leg.
Anyway November and December are coming.
Sunday, October 9, 2011
Is The Bull Coming?
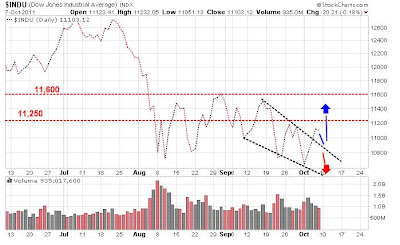
Both down targets set in our previous post on September 18 were reached last week in two successive days, on October 3 the Dow closed at 10,655 and the next day the intraday low was 10,404.
Now it looks like a bullish falling wedge formation was completed on October 6 with the penetration of the upper down trending line, if that is the case we will see the Dow rising with maybe a return move to the upper line before the take off.
Unlikely but possible, the Dow will retest the Lows before breaking the upper line for good. Anyway, the falling diagonal is most of the time a bullish formation.
What to do?
Wait for a decisive close above 11,250 or if you want to be really sure wait for a close above 11,600, before going long. If the bull is really coming there will be plenty of time to make money in the long direction.
Sunday, September 18, 2011
Long road for market direction
Last Friday we had an unusual day in which gold, the US dollar and the markets all closed positive. Gold spot price closed 1.22% higher at 1,814.60, the Dollar Index closed at 76.60 for a 0.47% gain, and the Dow Jones had a final level of 11,509.09 resulting in a 0.66% advance.
Normally these three do not trade in the same direction, having more of an inverse relation between them, which is why we are thinking right now of disarray in the markets with the resulting drop in the next days. However one day does not make a tendency so we will have to wait this week for clarification.
Unfortunately we can’t wish the markets on a direction; the most we can do is exam the possible scenarios and then be ready for action.
The Dow is trading inside a perfect parallel lines channel, it is very difficult and most of the time unprofitable to trade inside a price channel, it is better to wait for the breaking of any one of the lines that will signal the future trend.
We have several possible outcomes for the market in the following weeks:
a) The market keeps going up, breaks above the upper channel line and signals definitively a new uptrend for the markets. That will be the moment for covering all the shorts and start looking for the best groups to go long.
b) The Dow keeps going up but stops right before breaking the upper trend line, around 11,800, and then starts down. If that is the case, you can start your short positions and be in the look out for a violation of the lower trend line. The target will be Dow Jones around 10,700.
c) The Dow Jones stop its five days run and start going down next week, then a triangle like formation will develop before the breaking of the lower trend line. You can start building your short house around the time of the formation of the triangle. The target is Dow Jones around 10,460.
Four year presidential Cycle
This Stock Market Cycle occurs with great regularity, it pays to be aware of it. According to Stan Weinstein in his book “Secret for profiting in bull and bear markets”, the cycle unfolds like this:
First Year: “But even more important is the reality that no matter who is elected, the year following the election is usually a disaster.”
Second Year: “Historically, the probabilities are strong that in the second year the bear market will continue until a bottom is reached around midyear.”
Third Year: “The third year of the presidential term is the best one of the cycle”
Fourth Year: “The fourth year, which is the election year, is a choppy one”
Data compiled for the last 20 years and six presidents, concurs with Mr. Weinstein description of the Cycle as we can see in the following table.
The Dow Jones returned an average of 8.60% in the first year of the presidential Cycle of the last six presidents, also there is only one first year with a loss for the Dow of the six first years, making the first year a winner in 83% of the time.
In second years, the Dow averaged a gain of 6.11%, slightly less than in first years; also the Dow had 2 losing second years out of six, making the second year a winner 67% of the time.
We are now running President’s Obama third year of the Cycle that it’s to end in October 31 of this year, the data for the past 5 presidents shows us that there is not a single third year loser for the markets, and the average is 20.85% gain for the Dow.
Let’s see now the monthly averages.
According to data found at moneychimp.com, from 1950 to 2009, September is the worst month for the markets overall, it has the lowest average return and also lowest percent of winning over the years. September is a wining month only 43% of the time over the last 60 years.
November and December are the best months for stocks, December is the winner overall, and the three months period from November to January constitute the best quarter run for the markets
What to expect? The Dow ended at 11,118.40 in October 29, 2010, finishing the second year of Mr. Obama presidential Cycle. The Dow closed this past Friday, Sep, 16, 2011, at 11509, so as of date the Dow is returning 3.52% in this Third year. There are 30 trading days left until October 29.
For this September the Dow is showing a 0.90% loss to date, keeping in line with September tradition.
We can fairly expect more zigzags or another drop until the end of October, after that it may pay to enter the markets again. Anyway REMEMBER, these are just statistics, at the end the stock market will do not what politics or the gnomes of Zurich want, but what the economy tells it.
Saturday, August 27, 2011
Bermuda Triangle for the Dow??
After the Dow Jones Industrial dropped almost 16% from July 27 to August 10, some kind of consolidation pattern ought to form; a triangle continuation pattern appears to be in the way right now in the markets.
Look closely at the Dow Jones next week, if this proposed triangle forms, the end will be near the last part of the week. A break below the lower ascending line would confirm the conclusion of the formation, some times a return move takes the price to the lower line, sometimes a return move does not occur, after the breaking of the line the next stop for the Dow is 10,250.
Sunday, August 14, 2011
Nature's Law ?
Elliot Rules, guidelines and interpretation
Two of the motive waves in a 5 waves impulse tend toward equality in time and magnitude, also wave 3 is never the shortest. Let’s see how these guidelines conform to this count.
Wave 1 from 12,724.41 to 11,866.62, 857.79 Dow points, 6.74% drop in 9 trading days.
Wave 2 up to 11,896.44 hum?
Wave 3 from 11,896.44 to 10,719.94, 1,176.50 Dow points, 9.89%, in 5 trading days.
Wave 5 should be equal to wave 1 or a 0.618 relationship, resulting in 857 or 529 points.
Sub Waves (1) (2) (3) (4) (5)
(1) from 11,896.44 to 11,383.68, 512.76 points, 4.31%
(2) to 11,444.61 retraced 11.88%
(3) from 11,444,61 to 10,809.85, 634.76 points, 5.55%
(4) to 11,239.77, retraced 68% of (3)
(5) from 11,239.77 to 10,719.94, 519.83 points, 4.62%
Total sub wave move from 11,896.44 to 10,719.84 is 1,176.60 points or 9.89% from 0, the 0.618 golden division is at 6.11% or a level of 11,169.57, very near wave 4 (less than 1%).
So if this wave count is correct we are in wave 4, let’s see where it takes us, it can be a straight up line but most possibly wave 4 will be a triangle that always occurs in wave 4.
The 15.75% drop in the Dow in 14 days should warn us that the market will take some time to consolidate.
Sunday, July 24, 2011
A five wave Elliot pattern?
In this Dow Jones Chart and the accompanying table, let’s see if an identifiable Elliot wave pattern emerges.
Most of the times third waves are the extended ones, in our case wave III advanced the most, going from 11,934.58 to 12,719.49 for an impressive 6.58% gain in 8 trading days.
As wave I resulted in a 2.46% gain, the relationship between III and I is 6.58/2.46 or 2.67 times, very near the 2.618 Fibonacci number.
When wave III is extended, waves I and V tend towards equality, wave I with its 2.46% gain and wave V with 2.74% are very near correspondence, with only an 11% variation.
The golden section (0.618 – 0.382) is present in Elliot patterns.
When wave III is extended a textbook golden section forms in wave IV both in percent and in time. Wave 5 went from 11,897.27 at the start of I to 12,724.41 in our proposed end of wave V, for a 6.95% total gain in this movement. Now, the 0.618 part of this movement is a 4.30% advance from 0, resulting in a reading of 12,408.85.
12,408.85 is almost exactly our 12,385.16 level for fourth wave, also the 0.618 part of the 25 trading days is 15 days, the amount of time from 0 to the top of wave III.
They say chartists are guilty of seeing formations and patterns anyway they look at a chart and this could be no exception to that, patterns are easily identifiable after they end, that’s what makes speculating in stocks a very difficult art.
The following weeks will shed light about our proposed model; in the meantime my advice is extreme care with your long positions.
Subscribe to:
Posts (Atom)
Followers
Blog Archive
About Me
- Erick Stern
- From the Dominican Republic - Swing Trader Speculator - Civil Engineer/Project Manager - sternloinaz@gmail.com