Hi, these are just ideas not recommendations, sometimes I trade my ideas, sometimes I don’t.
Always remember, yours is the responsibility for your trades,
Good luck,
Erick


Sunday, October 9, 2011

Is The Bull Coming?

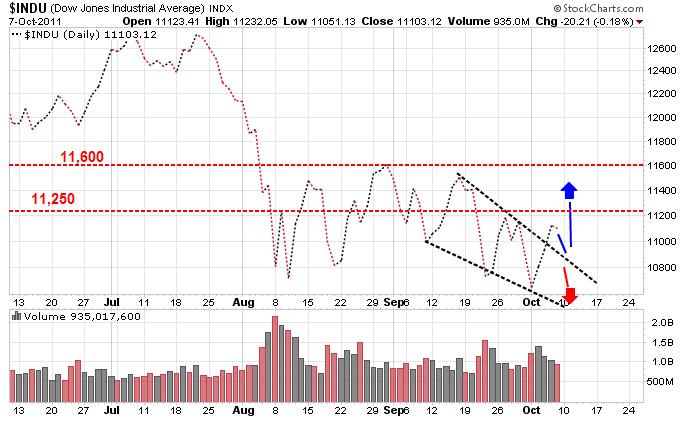
Both down targets set in our previous post on September 18 were reached last week in two successive days, on October 3 the Dow closed at 10,655 and the next day the intraday low was 10,404.


Now it looks like a bullish falling wedge formation was completed on October 6 with the penetration of the upper down trending line, if that is the case we will see the Dow rising with maybe a return move to the upper line before the take off.

Unlikely but possible, the Dow will retest the Lows before breaking the upper line for good. Anyway, the falling diagonal is most of the time a bullish formation.


What to do?

Wait for a decisive close above 11,250 or if you want to be really sure wait for a close above 11,600, before going long. If the bull is really coming there will be plenty of time to make money in the long direction.

Sunday, September 18, 2011

Long road for market direction

Last Friday we had an unusual day in which gold, the US dollar and the markets all closed positive. Gold spot price closed 1.22% higher at 1,814.60, the Dollar Index closed at 76.60 for a 0.47% gain, and the Dow Jones had a final level of 11,509.09 resulting in a 0.66% advance.

Normally these three do not trade in the same direction, having more of an inverse relation between them, which is why we are thinking right now of disarray in the markets with the resulting drop in the next days. However one day does not make a tendency so we will have to wait this week for clarification.

Unfortunately we can’t wish the markets on a direction; the most we can do is exam the possible scenarios and then be ready for action.


The Dow is trading inside a perfect parallel lines channel, it is very difficult and most of the time unprofitable to trade inside a price channel, it is better to wait for the breaking of any one of the lines that will signal the future trend.

We have several possible outcomes for the market in the following weeks:

a) The market keeps going up, breaks above the upper channel line and signals definitively a new uptrend for the markets. That will be the moment for covering all the shorts and start looking for the best groups to go long.
b) The Dow keeps going up but stops right before breaking the upper trend line, around 11,800, and then starts down. If that is the case, you can start your short positions and be in the look out for a violation of the lower trend line. The target will be Dow Jones around 10,700.
c) The Dow Jones stop its five days run and start going down next week, then a triangle like formation will develop before the breaking of the lower trend line. You can start building your short house around the time of the formation of the triangle. The target is Dow Jones around 10,460.

Four year presidential Cycle

This Stock Market Cycle occurs with great regularity, it pays to be aware of it. According to Stan Weinstein in his book “Secret for profiting in bull and bear markets”, the cycle unfolds like this:
First Year: “But even more important is the reality that no matter who is elected, the year following the election is usually a disaster.”
Second Year: “Historically, the probabilities are strong that in the second year the bear market will continue until a bottom is reached around midyear.”
Third Year: “The third year of the presidential term is the best one of the cycle”
Fourth Year: “The fourth year, which is the election year, is a choppy one”

Data compiled for the last 20 years and six presidents, concurs with Mr. Weinstein description of the Cycle as we can see in the following table.


The Dow Jones returned an average of 8.60% in the first year of the presidential Cycle of the last six presidents, also there is only one first year with a loss for the Dow of the six first years, making the first year a winner in 83% of the time.

In second years, the Dow averaged a gain of 6.11%, slightly less than in first years; also the Dow had 2 losing second years out of six, making the second year a winner 67% of the time.

We are now running President’s Obama third year of the Cycle that it’s to end in October 31 of this year, the data for the past 5 presidents shows us that there is not a single third year loser for the markets, and the average is 20.85% gain for the Dow.

Let’s see now the monthly averages.


According to data found at moneychimp.com, from 1950 to 2009, September is the worst month for the markets overall, it has the lowest average return and also lowest percent of winning over the years. September is a wining month only 43% of the time over the last 60 years.
November and December are the best months for stocks, December is the winner overall, and the three months period from November to January constitute the best quarter run for the markets

What to expect? The Dow ended at 11,118.40 in October 29, 2010, finishing the second year of Mr. Obama presidential Cycle. The Dow closed this past Friday, Sep, 16, 2011, at 11509, so as of date the Dow is returning 3.52% in this Third year. There are 30 trading days left until October 29.
For this September the Dow is showing a 0.90% loss to date, keeping in line with September tradition.

We can fairly expect more zigzags or another drop until the end of October, after that it may pay to enter the markets again. Anyway REMEMBER, these are just statistics, at the end the stock market will do not what politics or the gnomes of Zurich want, but what the economy tells it.

Saturday, August 27, 2011

Bermuda Triangle for the Dow??

After the Dow Jones Industrial dropped almost 16% from July 27 to August 10, some kind of consolidation pattern ought to form; a triangle continuation pattern appears to be in the way right now in the markets.


Look closely at the Dow Jones next week, if this proposed triangle forms, the end will be near the last part of the week. A break below the lower ascending line would confirm the conclusion of the formation, some times a return move takes the price to the lower line, sometimes a return move does not occur, after the breaking of the line the next stop for the Dow is 10,250.

Sunday, August 14, 2011

Nature's Law ?


Elliot Rules, guidelines and interpretation

Two of the motive waves in a 5 waves impulse tend toward equality in time and magnitude, also wave 3 is never the shortest. Let’s see how these guidelines conform to this count.

Wave 1 from 12,724.41 to 11,866.62, 857.79 Dow points, 6.74% drop in 9 trading days.
Wave 2 up to 11,896.44 hum?
Wave 3 from 11,896.44 to 10,719.94, 1,176.50 Dow points, 9.89%, in 5 trading days.

Wave 5 should be equal to wave 1 or a 0.618 relationship, resulting in 857 or 529 points.

Sub Waves (1) (2) (3) (4) (5)
(1) from 11,896.44 to 11,383.68, 512.76 points, 4.31%
(2) to 11,444.61 retraced 11.88%
(3) from 11,444,61 to 10,809.85, 634.76 points, 5.55%
(4) to 11,239.77, retraced 68% of (3)
(5) from 11,239.77 to 10,719.94, 519.83 points, 4.62%

Total sub wave move from 11,896.44 to 10,719.84 is 1,176.60 points or 9.89% from 0, the 0.618 golden division is at 6.11% or a level of 11,169.57, very near wave 4 (less than 1%).

So if this wave count is correct we are in wave 4, let’s see where it takes us, it can be a straight up line but most possibly wave 4 will be a triangle that always occurs in wave 4.
The 15.75% drop in the Dow in 14 days should warn us that the market will take some time to consolidate.


Sunday, July 24, 2011

A five wave Elliot pattern?


In this Dow Jones Chart and the accompanying table, let’s see if an identifiable Elliot wave pattern emerges.

Most of the times third waves are the extended ones, in our case wave III advanced the most, going from 11,934.58 to 12,719.49 for an impressive 6.58% gain in 8 trading days.
As wave I resulted in a 2.46% gain, the relationship between III and I is 6.58/2.46 or 2.67 times, very near the 2.618 Fibonacci number.

When wave III is extended, waves I and V tend towards equality, wave I with its 2.46% gain and wave V with 2.74% are very near correspondence, with only an 11% variation.

The golden section (0.618 – 0.382) is present in Elliot patterns.
When wave III is extended a textbook golden section forms in wave IV both in percent and in time. Wave 5 went from 11,897.27 at the start of I to 12,724.41 in our proposed end of wave V, for a 6.95% total gain in this movement. Now, the 0.618 part of this movement is a 4.30% advance from 0, resulting in a reading of 12,408.85.

12,408.85 is almost exactly our 12,385.16 level for fourth wave, also the 0.618 part of the 25 trading days is 15 days, the amount of time from 0 to the top of wave III.

They say chartists are guilty of seeing formations and patterns anyway they look at a chart and this could be no exception to that, patterns are easily identifiable after they end, that’s what makes speculating in stocks a very difficult art.

The following weeks will shed light about our proposed model; in the meantime my advice is extreme care with your long positions.

Saturday, July 2, 2011

Elliot .......Anyone?

Wave (A) went from 12810.54 to 11897.27 totaling 913.27 units down, wave (B) length as of Friday’s close is 685.5, resulting on a 75% retrace of wave (A). If this is really a zigzag correction (because of the 5-3 A-B), the end of wave (B) must be near.


Let’s review the zigzag rules and guidelines:
Wave (A) always subdivides into an impulse or leading diagonal. PASS
Wave (B) always subdivides into a zigzag, triangle or combination. PASS
If wave (B) if a zigzag it will retrace 50 to 79% of wave (A). PASS as of Friday 07/01.
In a zigzag the top of (B) is lower than the start of (A). PASS as of Friday 07/01

The breaking of the 2-4 uptrend line warns us of a change of pace, also the S&P bullish percentages are in bear mode.


Sentiment: The 5% - five day gain of the DOW looks like a bull trap. Start looking for shorts or at least be very careful in your long positions. Parabolic SAR of your holdings or momentum should give ample warning.

BlogCatalog

Investing Blogs - BlogCatalog Blog Directory

Followers

Blog Archive

About Me

From the Dominican Republic - Swing Trader Speculator - Civil Engineer/Project Manager - sternloinaz@gmail.com