
Tuesday, November 15, 2011

Sunday, November 13, 2011
Triangle, Flat, Zigzag or What
I confess that I´m obsessed with the ratio analysis between waves and the purported fractal configuration of the market and waves; being that, let’s review the relationship.

Proposed Wave (a) could easily be 2 since 1576 points (12231-10655) is a 76% of 2069 (12724 – 10655), however now it doesn´t look that way, in the triangle A is 574 points, B is 513, C is 389, D is 373 and E could be 240 to end around 11900. That way we´ll have E/C= 0.618, C/A= 0.678, so if this is a (b) triangle it must certainly stop above the lower line with a possibility of an intraday undershoot. Citing Prechter , ¨ triangles always occurs in a position prior to the final actionary wave in the pattern of one larger degree¨, the (b) triangle wave of 2 fits that description perfectly.
Wave a of (a) is 989, 9.3% from 10655 to 11644 in 11 days, wave b is 247 or 25% of a, c of (a) is 834 or 7.3% in 11 days, we have a perfect time relationship between a and c of (a).
Now, if (b) is in fact a triangle ending around 11900, (c) must have some relationship with (a), .618 of (a) is 973 would carry (c) to 12873 right above our purposed 0, .382 of (a) is 602 ending (c) around 12500, I am not sure of the triangle now thinking about maybe a double tree.
12400 is the level for Wave 2 retracing 85% of 1, in that view I cannot see the markets going up much next week.

Proposed Wave (a) could easily be 2 since 1576 points (12231-10655) is a 76% of 2069 (12724 – 10655), however now it doesn´t look that way, in the triangle A is 574 points, B is 513, C is 389, D is 373 and E could be 240 to end around 11900. That way we´ll have E/C= 0.618, C/A= 0.678, so if this is a (b) triangle it must certainly stop above the lower line with a possibility of an intraday undershoot. Citing Prechter , ¨ triangles always occurs in a position prior to the final actionary wave in the pattern of one larger degree¨, the (b) triangle wave of 2 fits that description perfectly.
Wave a of (a) is 989, 9.3% from 10655 to 11644 in 11 days, wave b is 247 or 25% of a, c of (a) is 834 or 7.3% in 11 days, we have a perfect time relationship between a and c of (a).
Now, if (b) is in fact a triangle ending around 11900, (c) must have some relationship with (a), .618 of (a) is 973 would carry (c) to 12873 right above our purposed 0, .382 of (a) is 602 ending (c) around 12500, I am not sure of the triangle now thinking about maybe a double tree.
12400 is the level for Wave 2 retracing 85% of 1, in that view I cannot see the markets going up much next week.
Sunday, November 6, 2011
Complicated, yet Simple
Here´s a thought from the forest to the trees

The big zigzag started after the Dow topped at 14,093 on the October 8 2007 week, the A wave ended at 6626.94 for a 7466 points or 53% decline from the top.
Big B ended at 12681 for a total of 6055 points, retracing 81% of A, now, B was a 3 a-b-c movement that developed like this:
a, 6626 – 11204 = 4578 points
b, 11204 – 9686 = 1518 points, 33% of a
c, ended at B, 9686 – 12681 = 2995 points, 65% of a, cool
Let´s go to the trees

We have the ¨exact¨ end of B on July 21 at 12,724.41, then 1 ran 2069 points to 10,655.30 on October 3, the return move took the Dow to 12,231.11 on Oct 28 for 1576 points or a 76% of wave 1.
What is next?
a) 12231 was the end of 2, the market will drop to the vicinity of 10,200 or below but then, what will happen with the almost infallible Santa Claus rally on December?
b) Wave 2 hasn´t ended yet, and we are in the b part of an a-b-c wave 2. If that´s the case the following will happen. Wave b of 2 will go down to one of this levels:
11,632 with c stopping at 12,600 max, right below the upper resistance line
11,443 with c stopping at 12,400 at the internal trend line
11,000 with c around 12600 maximum
With a Fridays’ close at 11983, we have a minimum 3% drop for the following days.
Beware of the BIG formation; it can take the Dow to a hopefully truncated C around 8000.

The big zigzag started after the Dow topped at 14,093 on the October 8 2007 week, the A wave ended at 6626.94 for a 7466 points or 53% decline from the top.
Big B ended at 12681 for a total of 6055 points, retracing 81% of A, now, B was a 3 a-b-c movement that developed like this:
a, 6626 – 11204 = 4578 points
b, 11204 – 9686 = 1518 points, 33% of a
c, ended at B, 9686 – 12681 = 2995 points, 65% of a, cool
Let´s go to the trees

We have the ¨exact¨ end of B on July 21 at 12,724.41, then 1 ran 2069 points to 10,655.30 on October 3, the return move took the Dow to 12,231.11 on Oct 28 for 1576 points or a 76% of wave 1.
What is next?
a) 12231 was the end of 2, the market will drop to the vicinity of 10,200 or below but then, what will happen with the almost infallible Santa Claus rally on December?
b) Wave 2 hasn´t ended yet, and we are in the b part of an a-b-c wave 2. If that´s the case the following will happen. Wave b of 2 will go down to one of this levels:
11,632 with c stopping at 12,600 max, right below the upper resistance line
11,443 with c stopping at 12,400 at the internal trend line
11,000 with c around 12600 maximum
With a Fridays’ close at 11983, we have a minimum 3% drop for the following days.
Beware of the BIG formation; it can take the Dow to a hopefully truncated C around 8000.
Tuesday, November 1, 2011
End of the road....?
It looks like 12200 was the top of this move that started around 10655 for a 14.5% gain in 18 trading days, you knew that couldn’t last forever.
The market should hold above 11700 at today’s close, if not, a rethink of the waves must be made.
 A final up move will be the last chance for selling longs with a profit, that final move will end between 12000 and 12200, and then a consolidation can take the market to 11250. If reached, that is the level to start buying again.
Here is another look,

The market should hold above 11700 at today’s close, if not, a rethink of the waves must be made.
 A final up move will be the last chance for selling longs with a profit, that final move will end between 12000 and 12200, and then a consolidation can take the market to 11250. If reached, that is the level to start buying again.
Here is another look,

Sunday, October 30, 2011
OK, but what´s next?
There is some long term resistance around 12800, also the Dow stopped short of the internal trend line. I would be more comfortable if the index cross the line and it becomes support, that hasn’t come yet. We have a beautiful summation index, but you must remember is a bit lagging.


Wave U-V went from 10800 to 11645 for 845 points or almost 8%, if this wave was meant to be the biggest, the movement would have ended already around 12000.
Wave 1 on W-X is 550 points, wave 2 was a sharp 1 day correction of 207 points or an exactly 38 Fibonacci percent. Wave 3 still running is 557 points at Friday´s close. Hopefully the Dow will cross the internal trend line, if not, 11900 should act as support and the target for the end of the move will become clearer.

Mondays are the worst days of the week for the stock market, Fridays are the best so don’t be surprised if tomorrow the Dow closes low.
PS: Most of the times a compression of the moving averages gives us ample warning of a trend reversal, if that proves right you better let your profits run a little bit more.


Wave U-V went from 10800 to 11645 for 845 points or almost 8%, if this wave was meant to be the biggest, the movement would have ended already around 12000.
Wave 1 on W-X is 550 points, wave 2 was a sharp 1 day correction of 207 points or an exactly 38 Fibonacci percent. Wave 3 still running is 557 points at Friday´s close. Hopefully the Dow will cross the internal trend line, if not, 11900 should act as support and the target for the end of the move will become clearer.
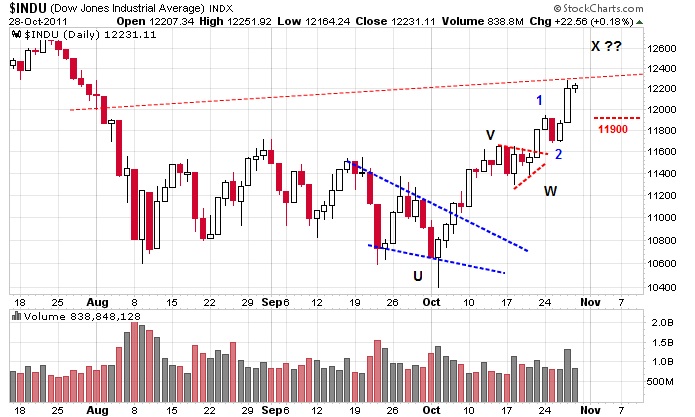
Mondays are the worst days of the week for the stock market, Fridays are the best so don’t be surprised if tomorrow the Dow closes low.
PS: Most of the times a compression of the moving averages gives us ample warning of a trend reversal, if that proves right you better let your profits run a little bit more.

Wednesday, October 26, 2011
Flextronics Price Reflex
The technology group has been lagging the general market for the last month but some industries within the group look strong. The electronic equipment industry is showing a one month positive relative strength against the Dow, within that group Flextronics is shinning with a RS above 10%.
Last Thursday after market close the company announced results for its second quarter ended September 30, net sales increased $622 million or 8% and the Co. generated $176 million of free cash flow for the quarter.
FLEX was trading inside a perfect up trending channel since mid-august, the upper line was broken in October 10 and seven days later it seemed that the price was returning to the channel.
The day following the announcement Flex broke decisively above the upper channel line closing almost 8% up with a super strong volume.

Channel measuring techniques result in a 7.30 immediate target for a quick 10% gain after today´s 6.63 close. The upper channel must act as support.
Disclosure: I bought FLEX today.
Last Thursday after market close the company announced results for its second quarter ended September 30, net sales increased $622 million or 8% and the Co. generated $176 million of free cash flow for the quarter.
FLEX was trading inside a perfect up trending channel since mid-august, the upper line was broken in October 10 and seven days later it seemed that the price was returning to the channel.
The day following the announcement Flex broke decisively above the upper channel line closing almost 8% up with a super strong volume.

Channel measuring techniques result in a 7.30 immediate target for a quick 10% gain after today´s 6.63 close. The upper channel must act as support.
Disclosure: I bought FLEX today.
Thursday, October 20, 2011
Is the First up Leg still going?
The Dow found support today around 11400, more or less over the internal trend line.
Both 10 and 20 days momentum are positive. The index went from 10655 to 11644, a 9+% gain in 9 trading days, a consolidation was mandatory.
Most of the times the first up waves after a big drop retrace up to a 75% of the movement so be in the lookout.

Resistance at 11600 must be broken decisively for a continuation of the up leg.
Anyway November and December are coming.
Both 10 and 20 days momentum are positive. The index went from 10655 to 11644, a 9+% gain in 9 trading days, a consolidation was mandatory.
Most of the times the first up waves after a big drop retrace up to a 75% of the movement so be in the lookout.

Resistance at 11600 must be broken decisively for a continuation of the up leg.
Anyway November and December are coming.
Subscribe to:
Posts (Atom)
BlogCatalog
