Hi, these are just ideas not recommendations, sometimes I trade my ideas, sometimes I don’t.
Always remember, yours is the responsibility for your trades,
Good luck,
Erick


Thursday, January 13, 2011

Quick Short Idea

This set up is only for January 13.

Olin Corp is set to announce on January 31.

Short at the close or very near, at 15 minutes or less to the close, at a price between 20.10 and 19.82, that’s a range of -0.99% to – 2.36% from Jan 12 close.

If you made the trade be aware of your stop loss level, at 20.35 is a range of 1.2% to 2.7% loss and the stock should not close above that level in the following two or three days.

Monday, December 13, 2010

Quick Review

I started shorting beginning November because the markets were showing what looked like the beginning of a down or consolidation period, on November 12 the SP500 closed below its ma(10) and on Nov 26 a clear downtrend line was formed suggesting more down prices to come.


Things didn’t work out as planed as the markets broke above the down line beginning December. My shorts didn’t perform so I started covering and opening long positions.


As markets continue going up, this Monday I have 4 profitable longs and one losing short. A quick graphic review of my longs follows:

Roc was bought on November 4 on the strength of the basic materials group. Roc held up great the November downtrend as it stays within an ascending channel. Beginning December Roc started a steeper tighter channel. As of today it is my best performing stock.


I entered CPNO on November 22 and right after I bought it started going down. CPNO held above the down line of the up trending channel. Let’s see where this canal takes the stock. I will start to worry if cpno closes below the low up trend line.


WMS was bought on December 3 as the ma(50) crossed above the ma(150) producing a very positive long term signal. The stock looks a little blown up now after it traded for five days above the upper Bollinger band. The ma(20) should acts as support.

My latest addition is CELL. I got Cell on December 8 as the stock broke above the bullish flag-type consolidation pattern.

If the markets don’t throw us a split finger ball again, those longs have good potential. For adding to my longs I am considering MGI and AKRX on the new strength of financials and the ever interesting health sector respectively.

Sunday, November 7, 2010

On fundamentals and technical

“With a common stock, few of us are rich enough to afford impulse buying.”
Philip Fisher

Two companies came to my attention last week after both posted solid earnings and revenue:

Rockwood Holdings, Inc. (ROC) is a global developer, manufacturer and marketer of high value-added specialty chemicals and advanced materials used for industrial and commercial purposes. ROC products consist primarily of inorganic chemicals and solutions and engineered materials. They are often customized to meet the complex needs of customers and to enhance the value of their end products by improving performance, providing essential product attributes, lowering costs and/or making them more environmentally friendly.
On Tuesday October 26, 2010, Rockwood Holdings, Inc. reported earnings per share from continuing operations of $0.52 for the third quarter of 2010 as compared to $0.14 for the same period in the prior year. Rockwood’s adjusted earnings per share from continuing operations increased to $0.55 in the third quarter of 2010 from $0.19 for the same period in the prior year. In addition, Rockwood reported Adjusted EBITDA of $169.1 million for the third quarter of 2010 as compared to $151.1 million for the same period in the prior year.

DIGI INTERNATIONAL INC. (DGII) operates as a device networking company that develops products and technologies to connect and manage local or remote electronic devices over a network, via the Internet or via satellite.
On Thursday October 28, 2010, Digi International Inc. reported revenue of $47.3 million for the fourth quarter of fiscal 2010 compared to $40.0 million in revenue for the fourth quarter of fiscal 2009, an increase of $7.3 million, or 18.1%. Revenue for the year-ended September 30, 2010 (fiscal 2010) was $182.5 million compared to $165.9 million for the year-ended September 30, 2009 (fiscal 2009), an increase of $16.6 million, or 10.0%.

The following table shows fundamental data for both companies and their related industry:

DGII P/E indicates an overvalued company vs its peers, however analyst estimates a forward P/E of 18 for the company, in line with the industry. DGII has very favorable price to cash flow compared with the sector and the industry. ROE for this year suffered because of revenue decrease primarily due to weakened economic conditions and changes in product mix. From 2005 to 2008 the company incremented sales in a 48% but from 2008 to 2009 sales decreased 10%. It can be expected that profit margin and ROE improve going forward along with the economy.
Low points: High P/E, low ROE, low profit margin.
High points: No debt, High cash flow generating.

With a 15 forward P/E, ROC looks undervalued. The company shows high ROE and a fair P/Book. The price to cash flow is very positive and the profit margin is in line with its peers
Low points: High debt, earnings growth estimate below industry.
High points: Good P/E, High ROE and lots of cash.

And for the fun part of this analysis we’ll go through the market, sectors and individual stocks.


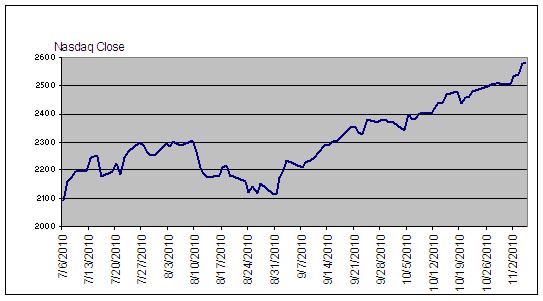
The Nasdaq continues its ascent started in the first days of September.


Looking at the 10 days momentum chart I see a decelerating rate of ascent. Despite the fact that a positive reading means the uptrend is still in effect, I would like to see the momentum breaks above the downtrending line.


The index 10-30 days moving average histogram continues on positive territory with a pause recorded around mid October. As long as this oscillator continues with a positive reading the uptrend should stay.


The basic materials and technology sectors represented by the iShares Dow Jones US Basic Materials (IYM) and the Technology Select Sector SPDR (XLK) ETFs, continue going up in line with the general market, they are both at a four month high.


-------------------------------------------------------------------------------------------------

Rockwood managed to close above 36 last Friday and is now in a new four month high. The moving average oscillator stopped the descent that started around mid October and looks ready to begin going up again. A positive market next week should result in rapid gains for ROC.


-----------------------------------------------------------------------------------------------

DGII has yet to make a new four month high, the stock paused from 10/20 to 11/2 and then started going up possibly fueled by good earnings news. The 10-30 indicator looks neutral, a positive reading next week will indicate a good entry point.

Sunday, October 31, 2010

On Relative Strength, shorts and others

“Buy that which is showing strength - sell that which is showing weakness. The public continues to buy when prices have fallen. The professional buys because prices have rallied. This difference may not sound logical, but buying strength works. The rule of survival is not to "buy low, sell high", but to "buy higher and sell higher". Furthermore, when comparing various stocks within a group, buy only the strongest and sell the weakest.”
From Richard Rhodes' Trading Rules

I interpret this rule in regard of the relative strength of the different sectors of the market. Investor sentiment shift over time, and the sectors that 15 days or one month ago were hot could be lagging the market now, you have to be constantly probing the sectors to get ready to adjust your investment or trades.

15 days ago and for the last three months to that date, industrials were leading the markets and the tech sector was behind, then a change of sentiment started to move money out of industrials and into technology. I set out to find some stocks in the tech sector to buy and at the same time to look for some industrial stock to short. Screening with various criteria I found the following companies that picked my interest.

Thermo Fisher Scientific, Inc. (TMO), is a technological company that provides analytical instruments, equipment, reagents and consumables, software, and services for research, manufacture, analysis, discovery, and diagnostics. Thermo Fisher serves pharmaceutical and biotechnology companies, hospitals and clinical diagnostic labs, universities, research institutions, government agencies, and environmental and industrial process control settings primarily in the United States, Germany, and England. It has a collaboration agreement with Proteomics Researcher. The company was founded in 1956 and is based in Waltham, Massachusetts.

Arrow Electronics, Inc. (ARW) The company operates in two segments, Global Components and Global Enterprise Computing Solutions. The Global Components segment offers semiconductor products and related services. It provides passive, electromechanical, and interconnect products comprising capacitors, resistors, potentiometers, power supplies, relays, switches, and connectors, as well as computing, memory, and other products. The Global Enterprise Computing Solutions segment offers enterprise and midrange computing products, services, and solutions to value-added resellers. It also offers access infrastructure, security, and virtualization software solutions, as well as midrange servers, storage, and software solutions.

AboveNet, Inc. (ABVT), together with its subsidiaries, provides high-bandwidth connectivity solutions to corporate enterprise clients and communication carriers primarily in the United States and the United Kingdom. The company provides communications infrastructure and global Internet protocol (IP) network to various companies, such as commercial banks, brokerage houses, insurance companies, investment banks, media companies, social networking companies, Web-centric companies, law firms, and medical and health care institutions.


IDEX Corporation (IEX) engages in the manufacture and sale of an array of pumps, flow meters, other fluidics systems and components, and engineered products worldwide. Its Fluid & Metering Technologies segment designs, produces, and distributes displacement pumps and flow meters, injectors, and other fluid-handling pump modules and systems; and provides flow monitoring and other services for water and wastewater.

I am going to evaluate the different tech companies and the industrial one to see if there is some merit in buying or shorting.

Relative strength
For the past 15 days the tech sector is showing strong relative strength against the market, the industrial sector is lagging the SP500, our three tech stocks have a positive RS vs their group. Of course a favorable RS does not mean your stock is going up, it only means that the stock or group is favorable among the complete stock universe.

Insider Transactions
In the last 12 months insiders sold 294,169 shares of IEX, more or less a 24% of shares in insider’s hands. ABVT insiders sold 961,532 shares in the last 12 months, a worrying 16% of their net holdings approximately. TMO insiders bought 70,898 shares in the last 12 months increasing their holdings in a 7% approximately, and ARW insider’s net transactions in the last year of 241,709 shares, incremented their holdings in an 8%.


Short Interest
ARW and IEX have more or less the same short level with 3% of the float shorted, I don’t want to short a heavily shorted stock but also I don’t want to buy it. I prefer low short interest either to buy or short. ABVT has a 8 days cover ratio, to me it means that short sellers (very sophisticated and well research traders) have a down sentiment on the stock.


Market Cap


Put Call Ratio
When the market is very bullish, the volume of call options will be much larger than the volume of put options because traders are optimistic about future price movements. ARW and ABVT have put/call ratio of 0.2 and 0.3 respectively.
The volume of call options will be smaller than the volume of put options, when the market is very bearish because traders are pessimistic about future price movements. TMO and IEX exhibit a ratio of 1.88 and 1.47.

Last 4 weeks closing prices
All the tech stocks in our study closed this week at the highest level in four weeks; IEX Friday’s close is the lower of the 4 previous Fridays.


There is no divergence in the prices of ARW and IEX with their RS, the analysis call for buying ARW and some interest in shorting IEX.

Wednesday, October 20, 2010

Yesterday Action

The 1.7% advance of the dollar yesterday may signal a shift in the direction of the market at least in the short term. The strong volume of traders buying dollars (the highest in three months) could be the beginning of money going out of stocks and into cash.


Long term the market looks strong with the Dow Jones trading cleanly above the 10 and 30 weeks moving average, however a one or two weeks correction can take you out of your hard earned profits. Since I trade with a short to medium term in mind, I sold all my positions yesterday with a small profit. I am convinced that making money in the stock market is a long race with the preservation of capital being the most important consideration.

Now it is probably a time to reassess, The Dow lost 1.48% yesterday the SP and the Nasdaq dropped in excess of 1.5% and the volume was significant. I will be waiting for a signal of the markets to start trading again. A simple bullish signal would be for the markets to overcome Monday’s high which is also the same as last week high level.

Start looking for medium term shorts if the market closes below yesterday close or below last week low.


For shorts you may consider looking at AKAM and JNPR.

Sunday, October 10, 2010

Rex Energy Corp

On August 31, Rex Energy Corporation (REXX) announced the following:

“Rex Energy will sell and transfer interests in its Marcellus Shale assets located in the Commonwealth of Pennsylvania, in a transaction valued at approximately $140.4 million. Under the transaction, Sumitomo will pay approximately $88.4 million in cash upon closing and an additional $52.0 million in the form of a drilling carry. “

REXX also presented us with the announcement that its present value of future cash flows before income taxes and asset retirement obligations (PV-10) grew approximately 87% to $357.2 million,.from the December 31, 2009, estimated of $190.5 million.

The market liked the transaction and announcement to the tune of a 10.2% increase in the stock price; also the volume that day was six times REXX average daily volume.

REXX share price kept climbing closing at 13.01 last Friday, which is an additional 15% rise since the August 31 close. In 29 trading days REXX climbed from 10.26 to 13.01, a 27% increase. That makes us wonder if REXX price appreciation is done for now, or if the high volume and price climbing is just the ignition to future gains.


REXX on balance volume climbed above the 50 day ma after August 31.

Since July 19 the SP500 has gained an 8.77%, in the same period energy stocks represented by the XLE Etf climbed 12.62% making energy one of the leading sectors of the market. REXX appreciated 25% since July 19.

What is not to like about REXX ?

The Nasdaq website reports almost 6 million REXX short shares, with a 11 days to cover ratio and a 18% of the float shorted, Big short sellers are very refined, informed and researched people, could they be wrong?

From Feb 2 to Aug 30 REXX short interest went from 3,018,696 to 4,385,470, an increase of more than 1,300,000 shares. In the same lapse the average price of REXX declined from 14 to 10 giving the short sellers great benefits.

But an interesting situation is developing since August 30, REXX short interest continued increasing to a Nasdaq-reported 5,985,076 short interest at Sep 15. At the same time the average price for REXX had gone from 10.90 to 12.70, more than 1 million short sales are losing money as of last Friday.


We will soon know the September 30 short interest, REXX is set to report on November 3, we have until then to speculate.

Sunday, September 26, 2010

Israel Stocks - Cellcom ( CEL )

On late May 2010, MSCI a leading provider of investment tools for investors globally, including asset managers, banks, hedge funds and pension funds, announced the reclassification of its MSCI Israel Index to the MSCI World Index, coming from the Emerging Markets Index.

With that classification is expected that Israel Stocks attract more institutional investor since the MSCI International Equity Indices are the most widely used global benchmarks in the industry and a number of funds and ETF include MSCI indexes in their investing.

The process at MSCI to reclassify the Israel Stocks started in July 2008, with MSCI analyzing and verifying that Israel complied with the following among other criteria:

The country Gross national Income per capita is 25% above the World Bank high income threshold for three consecutive years.
High securities liquidity of 20% or more than the calculated annualized traded value ratio.
Market accessibility criteria rated very high in the following:
Openness to foreign ownership
Ease of capital inflows / outflows
Efficiency of the operational framework
Stability of institutional framework


It is no surprise then that Israel stocks are outperforming the market as you can see in this graph showing the relative strength of the Israel market represented by the iShares MSCI Israel Cap Invest Mkt Index (EIS), measured against the benchmark S&P 500.

I started to look for dual traded Israelis Stocks and decided on Cellcom Israel Ltd. (CEL), a matured more or less monopoly with a 10% plus dividend yield.

Cellcom shows strong relative strength against the EIS Benchmark, meaning that EIS is set to outperform the markets and CEL is in line to do better than the EIS index.


CEL is not far from its ideal entry point around 28, target is at 32 for a quick 10% gain, consider closing your position below 27.75 for a 5% loss, that is a 2:1 risk / reward ratio.

BlogCatalog

Investing Blogs - BlogCatalog Blog Directory

Followers

Blog Archive

About Me

From the Dominican Republic - Swing Trader Speculator - Civil Engineer/Project Manager - sternloinaz@gmail.com