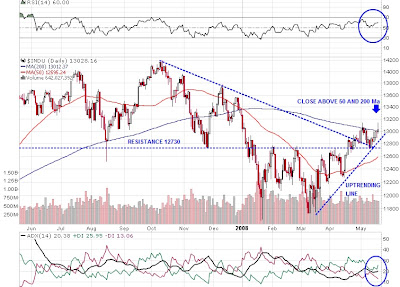
 At the close last Friday January 6, 2012 the Dow was showing a very similar appearance.
Take a look at a P&F chart of the Bullish percentages for the SP on May 19, 2008, a clear bull confirmed signal was in effect. The percentages were at 63, not yet in what is defined as a dangerous bullish zone.
 Last Friday the gauge was almost at the same level and a Bull sign was also running.
 Weekly speaking the Dow had produced three channel- buy signals in the last six weeks on 5/19/08, two of them were produced with the long and short term MA aligned up.
Last week there were two channel related buy signals in the last six weeks, also the MAs were signaling a powerful move to the upside.

Now you know what happened in the months following May 2008, I’m not suggesting anything; anyway the sure thing is that the market has its own law no matter what technical or fundamental are.

Yesterday was the 67th trading day of what we are calling wave 2, proposed wave 1 ran for 108 trading days, so yesterday we had an exact 0.62 relationship between waves.

The market is stubbornly trading above an uptrend line, check for the 12515 level and the lower line in the following days, if 12515 is broken look for a ceiling around 12700.

No comments:
Post a Comment