Hi, these are just ideas not recommendations, sometimes I trade my ideas, sometimes I don’t.
Always remember, yours is the responsibility for your trades,
Good luck,
Erick


Monday, September 6, 2010

For Next Week

Here are the closing prices of the indexes on August 31 and on September 3 and the percent increases in three days of trading.

Index, Closing Price 8/31, Closing Price 9/3, Percent Increase

Nasdaq, 2114.03 - 2233.75 - 5.66%
Russell, 2000 602.06 - 643.36 - 6.86%
Dow Jones, 10014.72 - 10447.93 - 4.33%
Nyse, 6704.15 - 7055.03 - 5.23%

S&P 500, 1049.33 - 1104.51 - 5.26%
Are these impressive gains the startup of a new uptrend in the markets or are they just a dead cat bounce on a market (S&P) that in a four month period (4/23 – 8/24) lost 13.6%.
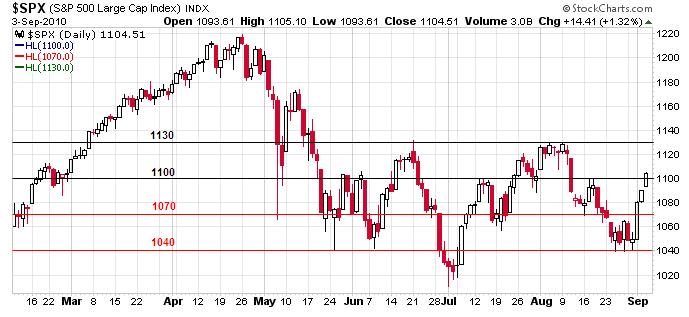
Let’s look at the support and resistance level in the S&P 500 trying to get some insight on the market.

For the longs:The 1100 level should stand its ground next week, a close above 1110 would be most desirable. Trading between 1100 and 1070 is meaningless, in fact a minor pullback is expected after a 3 day 5+% gain. We’d like the SP to open above 1110 (less than half percent point over Friday close) and stay above 1110 for the day. Next important resistance is at 1130.
For the shorts:
1070 is an immediate support level for the index, an opening below Friday close and a closing below 1070 would be great. There is some minor resistance at 1040 but below that it may be a free fall.

-------------- -------------------- ---------------------------- ----------------- -------------

Other way to look at the indexes are the simple moving averages which have the inconvenience of being lagging indicators, but after they are aligned in the downside, it is very hard and it needs a lot of buying for a stock or index to reverse direction.

The major indexes are still under the wicked dark cross, this signal occurs when the 50-day moving average crosses below the 200-day moving average. For some traders this is the uber-bearish signal. The SP came to be under the cross on July 5 when it closed at 1022.58, since that day the SP had gain over 8%. Maybe that cross isn’t so evil after all.

Previous to the July 5 cross, the ma(50) crossed below the ma(200) on Dec/21/2007, closing the day at 1484.46. After that the SP went to a loss of more than 50% until March 2009 when it started recovering. The dark cross is a signal to be reckoned with.


It is possible to make money buying long on a general down market, also the markets sooner or later are going to recover, meanwhile be very careful with your longs.

One profitable trading set up is the alignment of the 10, 20 and 50 simple moving averages either up or down. This set up on 7/30 failed when it could not drive the index higher; it looks ready to try again.


For long take a look at TOWN and CSR.
For short UHAL looks interesting.

Thursday, August 12, 2010

On Worth and Cramer

I read two articles on august 10 about the markets, and I would like to share some excerpts.

This one is from Bloomberg:
“Aug. 10 (Bloomberg) -- Stocks could go either way and anyone who claims to know their future is lying, according to Carter Worth, the third-ranked technical analyst in last year’s Institutional Investor survey.
A monthlong gain in the Standard & Poor’s 500 Index has left bulls and bears at a “a perfect standoff,” Oppenheimer & Co.’s Worth wrote in a note yesterday. It’s a “coin toss” as to whether the index will increase or retreat, he said.

Worth’s ambivalence highlights the challenge for investors as earnings rise at the fastest rate in 22 years even amid signs the economy is faltering. The S&P 500 rallied as much as 9.2 percent from its Dec. 31 close this year and dropped as much as 8.3 percent. It climbed 0.6 percent yesterday to 1,127.79, up 1.1 percent for 2010.

“This is the elegant, exquisite moment that you’ll see a handful of in your lifetime,” Worth said in an interview. “Anyone who says to you, ‘I know where it’s going,’ they’re lying to themselves and they’re lying to their clients.””

And the other article is from CNBC:
“ Cramer: ‘Fed Said Good Things-Buy’
cnbc.com | August 10, 2010 | 03:26 PM EDT
What’s the takeaway from Tuesday’s announcement from the Federal Reserve?

“They are not in the way.” Cramer said during Stop Trading!, meaning the central bank is doing whatever it can to promote an economic recovery.
The “Fed said good things,” Cramer said. “Buy””


Cramer and Worth are both outstanding personalities in the financial world, and both are in a way right, I more or less concur with Worth about the non-directional market, but after yesterday drop is coming close to become a bearish one.

This is my last post until after august 25 and I want to leave you with two trading ideas based on the ancient craft of point and figure chart interpretation.

Cymer Inc. (CYMI) and JDA software group Inc. (JDAS) are two companies in the technology sector and different industries, JDAS is a software company and CYMI is in the Semi-Conductor group.

On July 27 JDAS posted weaker-than-expected adjusted quarterly profit as operating expenses jumped 60 percent, but reported revenue that beat expectations.

The company earned 48 cents a share, excluding items, while total revenue rose 59 percent to $158.4 million.
Analysts on average were expecting earnings of 52 cents a share, excluding items, on revenue of $153.5 million, according to Thomson Reuters I/B/E/S.

At 12:25 PM EDT today JDAS is trading at 23 with a P/e of 90.20, it’s latest quarter figures set the following yearly results: Profit Margin 3.72%, return on assets 4.91%, return on equity 3.66% and current ratio 1.75.
Analysts estimate a 9.00% yearly growth for the following 5 years.

JDAS started a bearish formation when it traded at 24, breaking below a triple bottom formed at 25 with descending tops. Jdas stopped the down move at 22 reversing up to 25. Some traders like to short a bearish formation on the reversal move; others wait for a new breakdown. Price projections set the objective at 14.


On July 22, CYMI reported a 16% increase in revenue from the previous quarter, making this the sixth consecutive quarterly sales increase; also net income and EPS have been growing in the last 6 quarters. At 2:48 PM EDT today, CYMI is trading at 31.36 with a P/e of 15.75. With a 13.85% profit margin, ROA of 8.62% and ROE of 11.19%, some analyst would say that CYMI is a value stock.

With an estimate of 0.63 EPS for the next quarter, the forward P/e at today price is 13.81, combine that with analysts projections of an annualized growth of 19.73% for the next 5 years and you have a stock with a 0.70 PEG. Also adding to the good numbers, insiders lately have been buying the stock.

CYMI started a bullish formation when it traded at 34, almost immediately the stock reversed. Support is at 29, price objective is set at 48.


Good luck and remember short term is all about the market move, long term is about value.

Saturday, August 7, 2010

Axcelis Technologies Inc. (ACLS), and the symmetrical triangle

It’s said that chartist are guilty of seeing continuation or reversal patterns in almost any chart. A formed pattern isn’t reason enough for trading a stock but it can give you a perspective of the future move of the stock.

ACLS went from 0.80 on November 4/09 to 2.50 on April 26/10 for an impressive triple in six months. Of course that uptrend wasn’t sustainable forever and the stock gave back part of its gains trading lower until the 1.40 level reached on July 6.

Since then ACLS started trending higher forming what may be a bullish symmetrical triangle, which most of the times is a continuation pattern. The symmetrical triangle constitutes a pause of the original trend after which the prior trend is resumed.
A valid triangle needs at least four reversal points, meaning each converging line must be touched two times minimum.


If ACLS closes decisively over the upper converging line (blue) the bullish continuation pattern is confirmed, that line will be support for that moment on. The target would be the height of the triangle plus the price at breakout.

This triangle is coming to and end in one or two weeks, if the bullish pattern is going to work the price must close over in the following days, if not, there is a high possibility that prices will continue to drift out to the apex and beyond or start a new downtrend.

Thursday, August 5, 2010

Nucor and the price channels

Sometimes stock prices trend between two parallel lines forming what is known as a price channel.
When a channel is recognized it can be use for trading into the channel or you can wait for the breakout over the upper channel line in a downtrend to buy the stock.

On April 16 NUE ended an uptrend closing significantly below the lower channel line, the stock zigzag for a couple of weeks, and then started a downtrend between two well defined channel lines.

On July 20, Nucor closed at 39.82, 3.56% higher over the previous close and also broke over the down trending upper line. Measuring techniques put the price target an equal distance to the width of the channel, in this case 3.5 over the breakout price of 39. That results on a target of 42.50.

At yesterday closing price of 40.30, the target price of 42.5 gives us a 5.25% profit.

Or you could buy NUE September 40 calls at around 1.6, that would give you a profit over 50% if the stock reaches the 42.5 target before September 17.


Sunday, August 1, 2010

Long and short ideas

Yo considero que el mercado actual es un mercado sin movimiento direccional, y la mejor acción en estos casos es no hacer nada hasta esperar señales de dirección, pero si tienes la necesidad de negociar aquí presento dos ideas.

I consider this market to be a non-directional movement market, most of the times on this market the best course of action is doing nothing until the market shows direction, but if you need to trade here I present two ideas.

Vamos a analizar dos stocks utilizando diferentes formas de estudio de gráficos con diferentes indicadores.

Let’s look at two stocks using various technical indicators and chart interpretation.

Primero: El caso Long para CXPO (Crimson Exploration Inc.)

First: Long case for CXPO
El “principio abanico” es una forma interesantísima de utilizar las líneas de tendencia, básicamente este principio indica que al romper 3 líneas de tendencia a la baja, una stock revertirá su tendencia y empezará a subir. Es llamado así pues las líneas de tendencia toman la forma de un abanico de manos. Por lo general las líneas descendentes se convierten en puntos de soporte. CXPO rompió sobre su tercera línea descendente el jueves 29, y el viernes continuó ascendiendo. De verificarse el cambio de dirección, el soporte estará por debajo de la tercera línea mas o menos a 2.90

The fan principle is an interesting use of the trend line, it indicates that a stock must break over 3 down trend lines before reversing tendency. It is called fan principle because the lines resemble a fan. Previously broken resistance lines usually became support. CXPO broke over its third down trend line on July 29 and keep up next day. If the new up trend continues, support will be below the third line at 2.90.


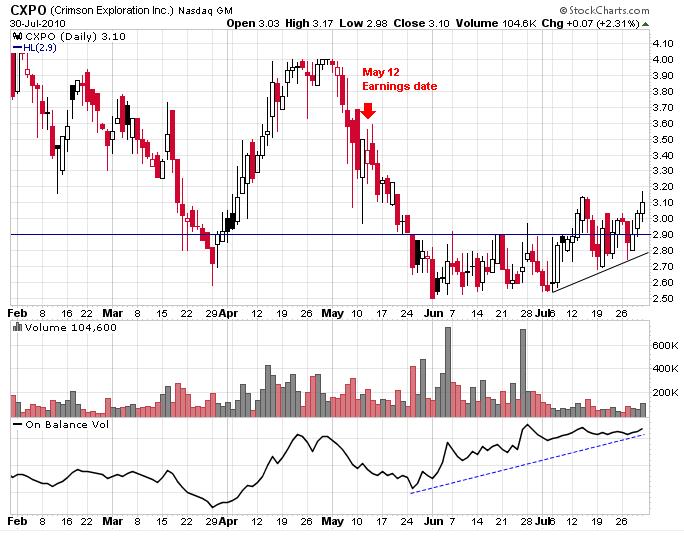
En el siguiente gráfico vemos como CXPO experimentó una fuerte resistencia en los 2.90, tocando ese nivel desde abajo durante todo un mes, luego a principios de Julio el precio subió sobre 2.90 durante 2 días para luego volver a caer bajo este nivel.
Nuevamente la stock se encuentra sobre 2.90, aparte desde principios de Julio, CXPO ha iniciado un modesto uptrend con los precios bajos en ascenso.

El OBV continúa una alza que inició desde principios de Junio, antes que el precio empezara a subir, lo que indica que el volumen mas grande se da en los altos.

Next graph shows strong resistance at 2.90, the stock was tapping that level from behind for more than a month. First days of July the stock closed over 2.90 for two days before going below that level again. Now CXPO is over 2.90 again but more important, since the start of July the stock initiated an uptrend with higher lows.

The on balance volume keeps going up since June, indicating the heavier volume is taking place on the upside.

CXPO está en la industria del petróleo y gas, anunciará resultados el próximo 12 de agosto.

CXPO is in the oil and gas industry, it is set to announce results on august 12.


Second: Short case for Cemex
Segundo: Vender short Cemex

My short idea is based in one of the oldest chart interpretation techniques. The point and figure charting have a starting date in 1886.
The Point and figure chart is a study of price movement, time is not taken on consideration while charting the price action.

The X represents rising prices and the O shows declining prices.

On July 27 Cemex announced more or less mediocre results, consolidated net sales decreased 3% in the second quarter of 2010 to approximately US$3.8 billion versus the comparable period in 2009 and operating income decreased 23% during the quarter compared with the same period last year.

CX chart shows a triple bottom at 9.5, the tops or X columns are making lower tops, suggesting that demand is drying up. If the stock touches the 9 level it means that the bottom has been violated, signaling a short sell.

Mi idea short está basada en uno de los mas viejos métodos de análisis técnico, el “point and figure charting” que posiblemente se inició en 1886.

Los gráficos “point and figure” solo estudian el movimiento del precio, las X representan precios a la alza y las O precios en baja.

Cemex declaró beneficios en Julio 27 que no fueron muy halagadores, sus ventas decrecieron en un 3% con relación al mismo cuarto un año atrás, también los ingresos operativos decrecieron un 23% con la misma comparación.

El gráfico de Cemex nos muestra la formación de un triple fondo en 9.5, aparte los altos han ido bajando desde 12 hasta 11 formando un tope descendente, lo que significa que la presión de compra es cada vez menor. El cierre de la stock a 9 o bajo 9 significa una señal de que el fondo ha sido violado y sería un indicativo para vender short la stock.

Sunday, July 25, 2010

Steel Dynamics, STLD

Steel Dynamics Reported Second Quarter 2010 Results On Monday July 19, 2010, 5:19 pm EDT, which were below the expectations. Also the company provided a cautious near term guidance.

In spite of the not so good results and guidance, next day STLD shares closed 1.93% higher, even though the stock opened the day 1.86% lower. The volume traded that day was the bigger in more than a month.


Now this looks like good news, when a company reports and its price goes up is a positive sign but we know that a stock price movement is more than 60% group and market related. Let’s take a look at the steel group that day.


Steel closed 4.91% higher on July 20. STLD 1.93% gain don’t look so hot, in fact the stock lagged the group, also the market closed the day with a 1.14% gain.


However there’s still hope for Steel Dynamics


If the strength of the market and steel keeps on, we certainly will see up movement on STLD.

It is said that things come in threes in the stock market; STLD broke over its third downtrend line on Friday, signaling the possible beginning of an uptrend.


STLD is trading above the 10,20 and 50 days moving average, also the ma(20) looks ready to cross over the ma(50), a move that will align the stock and the averages in an uptrend.


Professionals buy strength and sell weakness, next week a couple of steel companies are set to report earnings, if the results are good, the group up movement will carry STLD.

Do you want to speculate?

Buy STLD if the stock closes over the upper 4 week channel, 15.10 looks like a good limit, allow a limit 5% down movement two or three days after the trade, then if the stock moves up set your sell stop below the ma(20).


Saturday, July 24, 2010

El Ciclo Presidencial

El Ciclo Presidencial

Es una teoría sobre el comportamiento del mercado de valores Estadounidense que establece que el mercado se mueve según el año en que estamos con relación a la última elección presidencial.

Según la teoría desarrollada por Yale Hirsch, el año siguiente a las elecciones es malo para las bolsas de valores, luego a mediados del segundo año después de las elecciones, los mercados empiezan a recuperarse y el tercer año es el mejor del ciclo, el cuarto que es el año de elecciones de nuevo, es mediocre, débil en la primera mitad y un poco fuerte en la segunda. Al concluir las elecciones presidenciales, el ciclo empieza de nuevo.

Esta teoría fue muy confiable hasta mediados de los 1900, sin embargo en los tiempos modernos varios presidentes han tenido fuertes mercados de valores en su primer año.
En el primer año del presidente George H.W. Busch el mercado de valores subió un 25%, los dos períodos presidenciales del presidente Clinton tuvieron primeros años de mercados a la alza sobre el 19%. El 2009 fue el primer año luego de las elecciones del presidente Obama y los mercados de valores subieron sobre el 25%.

Aunque el ciclo presidencial es una teoría mas sobre el comportamiento de las bolsas de valores, sus fundamentos no dejan de ser reales, pues al instalarse un nuevo presidente debe tratar inmediatamente con los aspectos negativos y tomar las medidas mas duras, luego a partir de mediados de su presidencia y quizás pensando en una reelección, sus medidas económicas deben tender a una estimulación y crecimiento.

Estamos ahora en Julio de 2010 a mediados del segundo año del ciclo presidencial y si la teoría de Hirsch prueba cierta, tendremos un resto de 2010 y un 2011 con mercados a la alza.

BlogCatalog

Investing Blogs - BlogCatalog Blog Directory

Followers

Blog Archive

About Me

From the Dominican Republic - Swing Trader Speculator - Civil Engineer/Project Manager - sternloinaz@gmail.com