I consider this market to be a non-directional movement market, most of the times on this market the best course of action is doing nothing until the market shows direction, but if you need to trade here I present two ideas.
Vamos a analizar dos stocks utilizando diferentes formas de estudio de gráficos con diferentes indicadores.
Let’s look at two stocks using various technical indicators and chart interpretation.
Primero: El caso Long para CXPO (Crimson Exploration Inc.)
First: Long case for CXPO
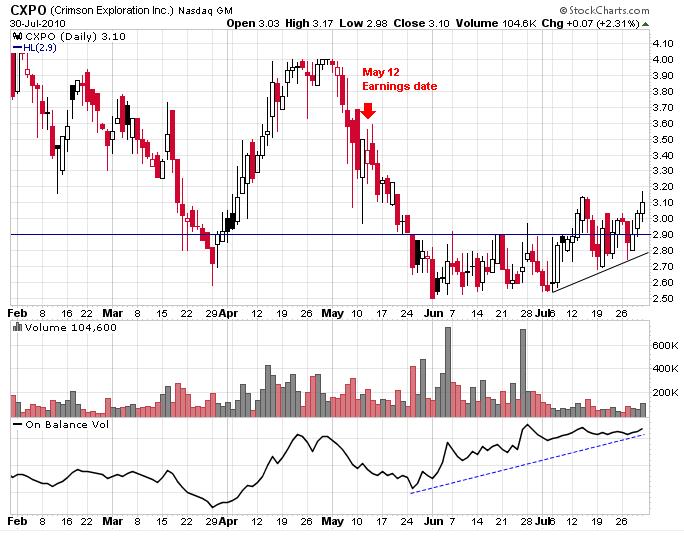
El “principio abanico” es una forma interesantísima de utilizar las líneas de tendencia, básicamente este principio indica que al romper 3 líneas de tendencia a la baja, una stock revertirá su tendencia y empezará a subir. Es llamado así pues las líneas de tendencia toman la forma de un abanico de manos. Por lo general las líneas descendentes se convierten en puntos de soporte. CXPO rompió sobre su tercera línea descendente el jueves 29, y el viernes continuó ascendiendo. De verificarse el cambio de dirección, el soporte estará por debajo de la tercera línea mas o menos a 2.90
The fan principle is an interesting use of the trend line, it indicates that a stock must break over 3 down trend lines before reversing tendency. It is called fan principle because the lines resemble a fan. Previously broken resistance lines usually became support. CXPO broke over its third down trend line on July 29 and keep up next day. If the new up trend continues, support will be below the third line at 2.90.

En el siguiente gráfico vemos como CXPO experimentó una fuerte resistencia en los 2.90, tocando ese nivel desde abajo durante todo un mes, luego a principios de Julio el precio subió sobre 2.90 durante 2 días para luego volver a caer bajo este nivel.
Nuevamente la stock se encuentra sobre 2.90, aparte desde principios de Julio, CXPO ha iniciado un modesto uptrend con los precios bajos en ascenso.
El OBV continúa una alza que inició desde principios de Junio, antes que el precio empezara a subir, lo que indica que el volumen mas grande se da en los altos.
Next graph shows strong resistance at 2.90, the stock was tapping that level from behind for more than a month. First days of July the stock closed over 2.90 for two days before going below that level again. Now CXPO is over 2.90 again but more important, since the start of July the stock initiated an uptrend with higher lows.
The on balance volume keeps going up since June, indicating the heavier volume is taking place on the upside.
CXPO está en la industria del petróleo y gas, anunciará resultados el próximo 12 de agosto.
CXPO is in the oil and gas industry, it is set to announce results on august 12.
Second: Short case for Cemex
Segundo: Vender short Cemex
My short idea is based in one of the oldest chart interpretation techniques. The point and figure charting have a starting date in 1886.
The Point and figure chart is a study of price movement, time is not taken on consideration while charting the price action.
The X represents rising prices and the O shows declining prices.
On July 27 Cemex announced more or less mediocre results, consolidated net sales decreased 3% in the second quarter of 2010 to approximately US$3.8 billion versus the comparable period in 2009 and operating income decreased 23% during the quarter compared with the same period last year.
CX chart shows a triple bottom at 9.5, the tops or X columns are making lower tops, suggesting that demand is drying up. If the stock touches the 9 level it means that the bottom has been violated, signaling a short sell.
Mi idea short está basada en uno de los mas viejos métodos de análisis técnico, el “point and figure charting” que posiblemente se inició en 1886.
Los gráficos “point and figure” solo estudian el movimiento del precio, las X representan precios a la alza y las O precios en baja.
Cemex declaró beneficios en Julio 27 que no fueron muy halagadores, sus ventas decrecieron en un 3% con relación al mismo cuarto un año atrás, también los ingresos operativos decrecieron un 23% con la misma comparación.
El gráfico de Cemex nos muestra la formación de un triple fondo en 9.5, aparte los altos han ido bajando desde 12 hasta 11 formando un tope descendente, lo que significa que la presión de compra es cada vez menor. El cierre de la stock a 9 o bajo 9 significa una señal de que el fondo ha sido violado y sería un indicativo para vender short la stock.


No comments:
Post a Comment