Index, Closing Price 8/31, Closing Price 9/3, Percent Increase
Nasdaq, 2114.03 - 2233.75 - 5.66%
Russell, 2000 602.06 - 643.36 - 6.86%
Dow Jones, 10014.72 - 10447.93 - 4.33%
Nyse, 6704.15 - 7055.03 - 5.23%
S&P 500, 1049.33 - 1104.51 - 5.26%
Are these impressive gains the startup of a new uptrend in the markets or are they just a dead cat bounce on a market (S&P) that in a four month period (4/23 – 8/24) lost 13.6%.
Let’s look at the support and resistance level in the S&P 500 trying to get some insight on the market.
For the longs:The 1100 level should stand its ground next week, a close above 1110 would be most desirable. Trading between 1100 and 1070 is meaningless, in fact a minor pullback is expected after a 3 day 5+% gain. We’d like the SP to open above 1110 (less than half percent point over Friday close) and stay above 1110 for the day. Next important resistance is at 1130.
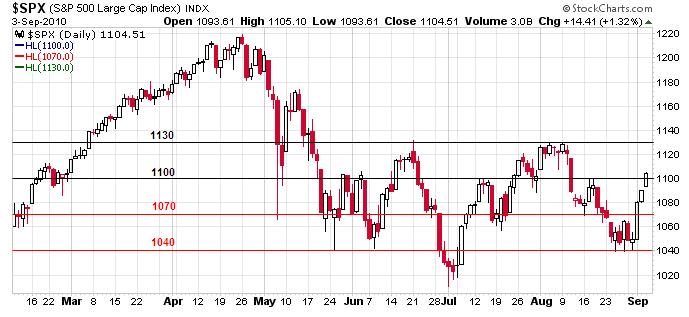 For the shorts:
1070 is an immediate support level for the index, an opening below Friday close and a closing below 1070 would be great. There is some minor resistance at 1040 but below that it may be a free fall.
-------------- -------------------- ---------------------------- ----------------- -------------
Other way to look at the indexes are the simple moving averages which have the inconvenience of being lagging indicators, but after they are aligned in the downside, it is very hard and it needs a lot of buying for a stock or index to reverse direction.
The major indexes are still under the wicked dark cross, this signal occurs when the 50-day moving average crosses below the 200-day moving average. For some traders this is the uber-bearish signal. The SP came to be under the cross on July 5 when it closed at 1022.58, since that day the SP had gain over 8%. Maybe that cross isn’t so evil after all.
 Previous to the July 5 cross, the ma(50) crossed below the ma(200) on Dec/21/2007, closing the day at 1484.46. After that the SP went to a loss of more than 50% until March 2009 when it started recovering. The dark cross is a signal to be reckoned with.
It is possible to make money buying long on a general down market, also the markets sooner or later are going to recover, meanwhile be very careful with your longs.
One profitable trading set up is the alignment of the 10, 20 and 50 simple moving averages either up or down. This set up on 7/30 failed when it could not drive the index higher; it looks ready to try again.

For long take a look at TOWN and CSR.
For short UHAL looks interesting.

No comments:
Post a Comment