Technical Analysis of the Financials Markets, Swing Trading Speculation
Always remember, yours is the responsibility for your trades,
Good luck,
Erick
Sunday, January 29, 2012
Dow Wilder Signals
A 0.63% drop will take the price below the parabolic SAR meaning and end of the uptrend in effect since mid-December. If the crossing of the SAR is followed by a change in the directional indicators, according to Wilder’s suggestion it is a short signal.
A 0.80% or more drop with the Dow below 12565 at the close will signal the crossing of Wilder’s Stop and reverse volatility system signal. Being a continuous system it means closing longs and shorting below that level.
A little far below is a 1.90% Monday’s close below Friday’s level that will reverse the positive 10 day momentum signaling the selling of longs and opening shorts.
Below is my 30 minutes alternate count with Wilder’s volatility Stop and Reverse for Monday.
Thursday, January 26, 2012
Dow January 26
Check for this 10 day momentum levels in the following days, a 2.41% drop is needed today to reverse momentum, a 2.2% from today’s level will take tomorrow 10 day’s momentum below 0.
Sunday, January 22, 2012
Wave 2 rule and the end of it
Now, the zigzag and double zigzag guidelines place the length of c equal to that of a, this guideline could be consider already fulfilled since the relationship is 0.96 at Friday’s close, a 1:1 amid a-c will put the end of c at 12761.30.
Looking at closing prices and a big zigzag
My 30 mins. preferred count is still valid, the guideline for a extended fifth wave have the 0.382 of the move within wave 4. If green 5 ended last Friday the 0.382 is at 12468, if it ends at 12761 the golden section is at 12483, also the guideline works for the end of 5 red with the 0.682 part within 4 red for an extended red 3.
According to data at indexarb.com, IBM is the highest weight stock in the Dow Jones with a 11.22% almost double of the nearest follower Chevron (CVX) that holds a 6.36% of the Dow. Following Chevron are Caterpillar (CAT) with 6.29%, MacDonalds (MCD) 6.25%, Exxom (XOM) 5.21% and 3m (MMM) with a 5.10% of the Dow.
IBM jumped 4.43% with big volume on Friday after earnings, stopping what looked like a bearish head and shoulder and taking the price above the ma(50) and also accounting for much of the 0.76% Dow Move.
CVX is set to report next Friday, CAT and MMM are scheduled for Thursday 26, and MCD is reporting next Tuesday 24. Any of those heavyweights are going to have big impact in the Dow price so watch for the action.
Wednesday, January 18, 2012
Dow Jones Wednesday 1/18/2012 3:23 PM
Monday, January 16, 2012
Nyse Advance Decline Figures
Sunday, January 15, 2012
Dow Update Jan 13
Also 12514.62 could be 5 with a 1-2-1-2 downward underway, in that case 12483.62 should hold.
An up trending line with some significance was broken last Friday, but we still need a break below a more important up line and the 12315 ≈ level.
12485 and 12315 are now the focal support & resistance levels.
Wednesday, January 11, 2012
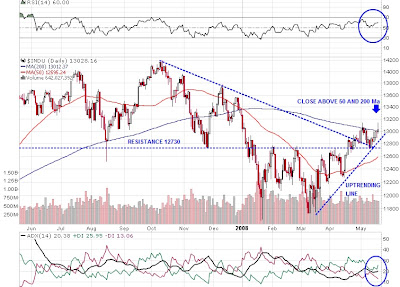
Similarities between May 2008 – January 2012
At the close last Friday January 6, 2012 the Dow was showing a very similar appearance.
Take a look at a P&F chart of the Bullish percentages for the SP on May 19, 2008, a clear bull confirmed signal was in effect. The percentages were at 63, not yet in what is defined as a dangerous bullish zone.
Last Friday the gauge was almost at the same level and a Bull sign was also running.
Weekly speaking the Dow had produced three channel- buy signals in the last six weeks on 5/19/08, two of them were produced with the long and short term MA aligned up.
Last week there were two channel related buy signals in the last six weeks, also the MAs were signaling a powerful move to the upside.
Now you know what happened in the months following May 2008, I’m not suggesting anything; anyway the sure thing is that the market has its own law no matter what technical or fundamental are.
Yesterday was the 67th trading day of what we are calling wave 2, proposed wave 1 ran for 108 trading days, so yesterday we had an exact 0.62 relationship between waves.
The market is stubbornly trading above an uptrend line, check for the 12515 level and the lower line in the following days, if 12515 is broken look for a ceiling around 12700.
Sunday, January 8, 2012
A few traditional technical signals and some untraditional opinions
Au contraire of the golden cross is the dark or black cross, a supposed bearish signal that comes in effect when the 50dma crossed below the 200 dma.
For the past 10 years we had some gold and dark crosses in the Dow, a total of 8 dark crosses registered in the index, the number of gold crosses were 9.
Dark signals are red, gold signals are blue:
Had we traded this signals the results would had been like this.
Of the 8 dark crosses only 2 produced profits although the January 08 cross gave a 36% profit, the 25% right times makes this signal a lousy trading strategy.
Of the 8 golden crosses in the last 10 years without the one in January 3, 2012, 4 signals resulted in positive results. The 50% of the time that this signal gives positive results makes it also an almost worthless trading signal.
The USD United States Dollar
The Federal Reserve Created and maintains three different Dollar Indexes
The Broad Index
“The broad index is a weighted average of the foreign exchange values of the U.S. dollar against the currencies of a large group of major U.S. trading partners. The index weights, which change over time, are derived from U.S. export shares and from U.S. and foreign import shares.” From Fed Website
The FED staff selected 26 currencies of countries whose bilateral U.S. imports or exports exceeded 0.50% of the total in 1997. Adjustments were made for taking the Euro into account.
The Major Currencies Index
“The major currencies index is a weighted average of the foreign exchange values of the U.S. dollar against a subset of currencies in the broad index that circulate widely outside the country of issue. The weights are derived from those in the broad index.”
For this index, seven of the twenty-six currencies in the broad index were selected. The Euro, Canadian Dollar, Japanese Yen, British Pound, Swiss Franc, Australian Dollar and Swedish Krona. These currencies trade widely in markets outside their areas and because of that the “Major Currencies Index” can be used to gauge financial market pressures on the dollar.
OITP (Other important trading partners) Index
“The OITP index is a weighted average of the foreign exchange values of the U.S. dollar against a subset of currencies in the broad index that do not circulate widely outside the country of issue. The weights are derived from those in the broad index.”
This Index in contrast to the evolution of the Major Currencies Index have trended upward since 1980 basically because the currencies in it have depreciated sharply as a result of high inflation in their respective countries.
I’m going to chart the Major Currencies Index trying to define a relationship between this Index and the Dow Jones. The data is from the FED website.
For the past 10 years The USD had made two lows almost at the same level, in march 2008 it closed at 70.35 in the beginning of the big 2009-2009 Dow Drop, The USD closed at 83.5 in February 2009, in a year the Index gained almost 19%, the Dow in that period dropped 45% from a close at 12262 in March 2008 to 7062 in February 2009.
The USD Index made a 10 year low in august 2011 at 69.07 the Dow closed at 11613 in that date, so we have a 2008 like situation now.
From 8/11 to this month the USD has gone from 69.07 to 72.83 for a 5% appreciation, the Dow closed last Friday at 12359 for a 6% gain since August 2011.
Someone must give; either the USD continues making new lows or the Dow is in the path of a correction.
Wednesday, January 4, 2012
Old post (12-11-11)
http://erickstern.blogspot.com/2011/12/again-wave-2.html
Original post: A relationship of equals between a and c looks improbable since wave c would end above 13000 so a 0.618 is with some high probability. That would put Dow at 12400 at the end of c. A more or less truncated c is in agreement with c of 2 of 1.
Original post: Time relationship, internal and external trendlines, put the c below 12400 at the end of this week or at 12500 at year's end.
Original Chart:
Today’s Chart:
Original post: And last but not least, the Dollar can make a last push before retracing and then not look back for a long time, the inverse relationship between markets and Dollar could work like this.
Original Charts:
Today Charts:
This supposed wave 2 has been running for too long, maybe we all are wrong in our wave count, if that’s true and been completely short , I can only say as that fabulous punk rocker David Byrne: “You may say to yourself, my god, what have I done?
Monday, January 2, 2012
2008 again?
Then you know what happened next:
Are we now in a similar market?
Umh?, the US Dollar is already moving higher and different from 2008 this supposed retrace from a down trend completed its 13th week two weeks ago. 2008 retrace took 8 weeks.
So what is coming?
Maybe these relationships have some meaning, we’ll see in the following days.
Closing prices
By the way almost all European markets closed strong today.
Feliz año nuevo a todos,
Followers
Blog Archive
-
▼
2012
(48)
-
▼
January
(11)
- Dow Wilder Signals
- Alternate 30 minutes count for the Dow
- Dow January 26
- Wave 2 rule and the end of it
- Dow Jones Wednesday 1/18/2012 3:23 PM
- Nyse Advance Decline Figures
- Dow Update Jan 13
- Similarities between May 2008 – January 2012
- A few traditional technical signals and some untra...
- Old post (12-11-11)
- 2008 again?
-
▼
January
(11)
About Me
- Erick Stern
- From the Dominican Republic - Swing Trader Speculator - Civil Engineer/Project Manager - sternloinaz@gmail.com